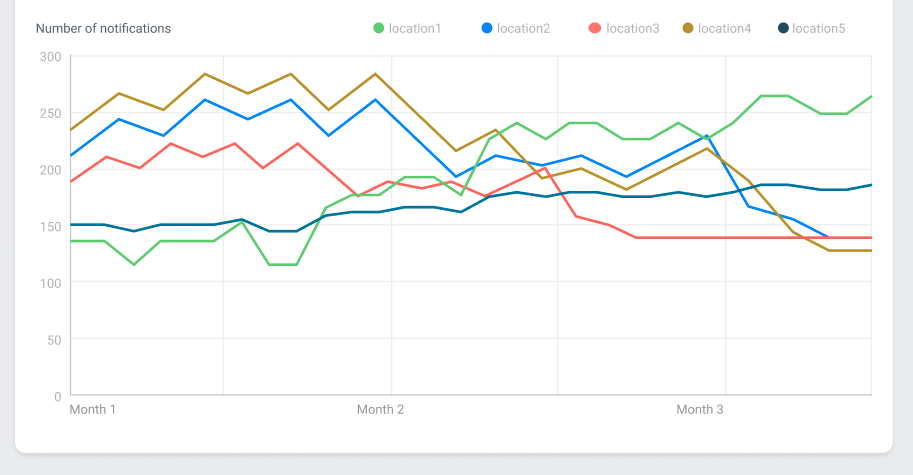
Environmental Monitoring Trend Analysis.
Environmental monitoring trend analysis for trends at an appropriate frequency is essential to aid in the interpretation of process stability and assess overall environmental control performance.
Appropriate alert and action limits should be set for the results of particulate and microbiological monitoring.
It’s possible to use the limits reported in FDA guidelines or Annex 1 of Eudralex – Volume 4 when the facility is new and/or there is not available data. When there is statistically significant data, it’s essential to establish the proper alert and action limits.
Statistical methods are intended to improve the quality of decision making.
The methods may be used in an ongoing program to analyze collected data.
Timely evaluation of data allows the prompt detection of undesired process variation, which facilitates process understanding and may mitigate response variability.
The case study discussed in this paper involves the use of trend analysis to analyze microbiological and total particle monitoring data and statistical analysis to define alert and action limits for grade A, B, C and D.
Analysis trends are useful in detecting patterns that could lead to future quality problems, and in anticipating future performance.
In the interpretation of GMP requirements, regulatory authorities increasingly request an assessment of trend inspections.
The prompt detection and evaluation of trends supports the implementation of corrective and preventive actions (CAPA) as suggested by ICH Q10.
The daily-acquired data of each parameter for each sampling point shall be taken for trend on a real-time basis.
Trend results shall be reported every month in a cumulative form for all sample results/locations
Monthly report shall contain the results of the current month and also it must containcumulative data of the previous dates for the year.
To draw a meaningful conclusion, from the acquired data, all the results shall be subjected to the basic calculations, (But not limited to these) minimum, maximum and average (mean) and Standard deviation from mean shall be determined.
For all the statistical results shall be reported for the current month and cumulative period/ year till date.
If any data is crossing the limit determined, then the comments must be given in the respective trend.
The data obtained can be used in the establishment of alert and action limits or in-house specifications.
An annual summary report shall be prepared for the data obtained for the entire year.
This annual summary shall consist of maximum readings of the year and minimum readings of the year.
This summary may be used for establishment of seasonal variation or to revise existing alert and action limits.