Introduction
Root Cause Analysis (RCA) in the pharmaceutical industry is a systematic approach used to identify the underlying reasons for quality problems, deviations, equipment failures, and unexpected laboratory results. Instead of correcting only the immediate problem, RCA aims to identify why the problem occurred and determine appropriate actions to prevent recurrence.
In pharmaceutical manufacturing, an incomplete investigation can lead to repeated deviations, ineffective Corrective and Preventive Actions (CAPA), and potential risks to product quality and patient safety. Therefore, investigations should be supported by objective evidence, scientific reasoning, and appropriate documentation.
Two commonly used RCA tools are the 5 Whys method and the Fishbone Diagram, also known as the Ishikawa or Cause-and-Effect Diagram. The 5 Whys method explores a sequence of causes by repeatedly asking “Why?”, while the Fishbone Diagram organizes potential causes into categories for systematic investigation.
This article explains how both methods work, their differences, when to use each, and how pharmaceutical professionals can apply them to real-world quality investigations.
What Is Root Cause Analysis in Pharma?
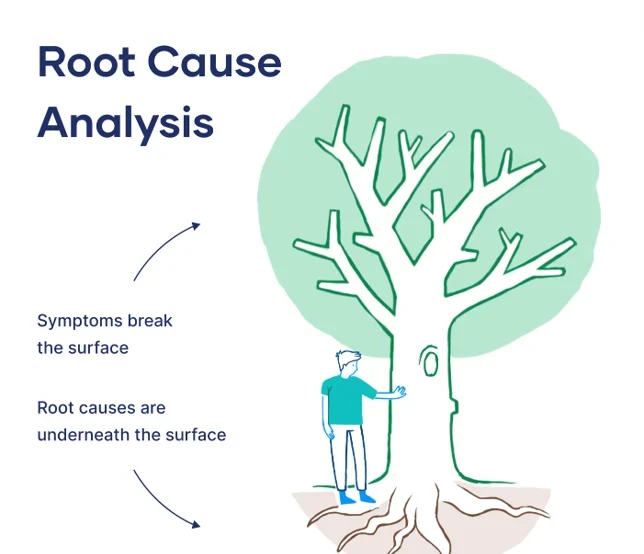
Root Cause Analysis is a structured investigation technique used to identify the underlying causes of an observed problem rather than stopping at its symptoms.
RCA may be used in pharmaceutical Quality Assurance (QA), Quality Control (QC), production, engineering, microbiology, warehousing, and other quality-related functions.
Common situations requiring root cause investigation include:
- Out-of-Specification (OOS) laboratory results. https://pharmavk.com/Why-is-Out-of-Specif/
- Repeated equipment breakdowns.
- Environmental monitoring excursions.
- Batch documentation errors.
- Manufacturing process deviations.
- Microbial contamination events.
- Recurring packaging defects.
- Data integrity incidents.
For example, if a microbiology laboratory repeatedly observes contamination in prepared culture media, simply preparing another batch may not solve the problem. The investigation may need to examine sterilization parameters, equipment performance, preparation practices, handling procedures, and supporting records.
Why Is RCA Important in Pharmaceutical Manufacturing?
Effective RCA helps organizations:
- Identify and address the underlying cause of a problem.
- Prevent or reduce recurrence.
- Support scientifically justified CAPA.
- Evaluate potential impacts on products, batches, and records.
- Improve process reliability and quality system performance.
- Support risk-based decision-making and continuous improvement.
ICH Q9(R1), Quality Risk Management, provides principles for evaluating and managing pharmaceutical quality risks. ICH Q10, Pharmaceutical Quality System, supports investigation, CAPA, and continual improvement within the pharmaceutical quality system.
What Is the 5 Whys Method?
The 5 Whys method is a simple root cause analysis technique in which investigators repeatedly ask “Why did this happen?” to explore the causal chain behind a problem.
Although it is called the 5 Whys method, investigators do not have to ask exactly five questions. The analysis may require fewer or more questions depending on the problem and the available evidence.
How to Perform the 5 Whys Method
Step 1: Define the problem clearly.
Describe what happened, where it happened, when it occurred, and the observed impact.
Step 2: Ask the first “Why?”
Identify the immediate reason for the problem using available evidence.
Step 3: Continue asking “Why?”
Explore why each identified cause occurred. Avoid jumping to conclusions or blaming an individual without evidence.
Step 4: Verify the causal chain.
Review relevant records, equipment logs, procedures, interviews, and test results to determine whether each proposed cause is supported.
Step 5: Identify corrective and preventive actions.
Develop actions that address the verified cause and evaluate whether they are likely to prevent recurrence.
Example of 5 Whys in Pharmaceutical Manufacturing
Problem: A batch manufacturing record contains a missing equipment cleaning entry.
| Question | Investigation finding |
|---|---|
| Why 1: Why is the cleaning entry missing? | The cleaning activity was not documented in the required record. |
| Why 2: Why was it not documented? | The operator completed the activity but overlooked the entry. |
| Why 3: Why was the entry overlooked? | The cleaning record was completed separately from the equipment checklist. |
| Why 4: Why were the records completed separately? | The documentation workflow did not clearly link the cleaning checklist with the batch record review. |
| Why 5: Why was this workflow gap not addressed? | The existing procedure did not adequately define how completion of the cleaning record should be verified before the equipment was released for use. |
Potential root cause to verify: An inadequate documentation and verification workflow allowed the required cleaning record to remain incomplete.
This is an illustrative investigation, not a conclusion that can be accepted without evidence. The actual root cause must be established using the specific records, procedures, and circumstances of the event.
Advantages of the 5 Whys Method
- Simple to understand and apply.
- Requires minimal specialized tools.
- Helps investigators move beyond immediate symptoms.
- Useful for problems with a relatively straightforward causal chain.
- Can be combined with other RCA tools.
Limitations of the 5 Whys Method
- May oversimplify complex problems with multiple causes.
- Can produce biased conclusions if questions are based on assumptions.
- May focus on one causal pathway while overlooking other contributors.
- Does not independently prove that a proposed cause is correct.
The 5 Whys method should therefore be supported by objective evidence and used with additional investigation tools when necessary.
What Is a Fishbone Diagram?
A Fishbone Diagram is a visual RCA tool used to organize potential causes of a problem into logical categories. It is also called an Ishikawa Diagram or Cause-and-Effect Diagram.
The problem is placed at the head of the diagram, while branches represent major categories of possible causes. Smaller branches identify specific contributing factors.
The method is particularly useful when several departments, processes, or conditions may contribute to the same problem.
Common Fishbone Categories in Pharmaceutical Manufacturing
A common starting point is the 6M framework: Man, Machine, Method, Material, Measurement, and Mother Nature (Environment). These categories can be adapted to suit pharmaceutical operations.
| Category | What to investigate | Pharmaceutical example |
|---|---|---|
| Man (People) | Training, competency, workload, communication | Operator not trained on a revised procedure |
| Machine (Equipment) | Equipment condition, maintenance, settings | Incubator temperature control malfunction |
| Method | SOPs, process steps, work instructions | Unclear instruction for a sampling activity |
| Material | Raw materials, reagents, media, consumables | Culture medium prepared using an unsuitable or expired component |
| Measurement | Calibration, instruments, methods, data recording | Incorrectly calibrated measuring device |
| Mother Nature (Environment) | Temperature, humidity, cleanliness, surrounding conditions | Uncontrolled laboratory temperature affecting an activity |
These categories are prompts for brainstorming, not a mandatory checklist. Other categories, such as software, management systems, utilities, or external suppliers, may be added when relevant.
How to Create a Fishbone Diagram
Step 1: Define the effect or problem.
Write a specific problem statement at the head of the diagram.
Step 2: Draw the main branches.
Create branches for the selected cause categories.
Step 3: Brainstorm possible causes.
Involve knowledgeable personnel from the relevant departments. Consider each category systematically.
Step 4: Add subcauses.
For each potential cause, ask why it might have contributed to the problem and add relevant sub-branches.
Step 5: Prioritize possible causes.
Use available evidence, risk assessment, records, and testing to decide which causes require further investigation.
Step 6: Verify the root cause.
A cause listed on the diagram is only a hypothesis until it is supported by evidence.
Example: Fishbone Analysis of a Microbial Contamination Event
Problem: Microbial contamination is detected during a pharmaceutical microbiology activity.
Possible causes may be organized as follows:
| Category | Potential causes to investigate |
|---|---|
| People | Gowning practice, aseptic handling, training |
| Equipment | Incubator condition, sterilizer performance, equipment cleaning |
| Method | Sampling procedure, media preparation, disinfection steps |
| Material | Culture media quality, reagent status, consumable integrity |
| Measurement | Incubation monitoring, instrument calibration, result recording |
| Environment | Airflow conditions, room cleanliness, personnel movement |
The team should use the observed contamination pattern, organism identification where appropriate, equipment and environmental records, and other relevant evidence to narrow down the possible causes.
For instance, if contamination is associated with a specific activity or location, the team may investigate the relevant handling steps and environmental conditions. The final conclusion must be supported by the investigation findings rather than selected solely because a cause appears plausible.
Advantages of the Fishbone Diagram
- Organizes multiple potential causes in one visual framework.
- Encourages cross-functional discussion.
- Helps investigators avoid focusing on only one explanation.
- Supports complex investigations involving several processes or departments.
- Can be combined with the 5 Whys method and other quality tools.
Limitations of the Fishbone Diagram
- Can generate many potential causes without identifying which one is correct.
- Depends on the quality of the information and participation.
- Does not rank or validate causes automatically.
- May become difficult to interpret when too many branches are included.
The Fishbone Diagram helps organize thinking, but additional evidence and investigation are needed to establish the root cause.
5 Whys vs. Fishbone Diagram: Key Differences
| Comparison | 5 Whys | Fishbone Diagram |
|---|---|---|
| Main purpose | Explore a causal chain in depth | Organize multiple possible causes |
| Structure | Sequential questions | Visual branches and categories |
| Best suited for | Relatively straightforward problems | Complex problems with several possible contributors |
| Team involvement | Can be performed individually or by a team | Often benefits from cross-functional brainstorming |
| Output | A sequence of possible causes | A structured list or diagram of potential causes |
| Limitation | May overlook alternative causal pathways | Does not prove which cause is correct |
| Verification required | Yes | Yes |
| Use with CAPA | Helps identify actions addressing a verified causal chain | Helps identify and prioritize causes requiring verification |
Neither method is universally superior. The appropriate choice depends on the nature of the problem, the complexity of the process, and the evidence available.
When Should You Use 5 Whys or a Fishbone Diagram?
Choose the 5 Whys method when a problem appears to have a relatively clear sequence of causes that can be investigated logically.
Use a Fishbone Diagram when several possible causes need to be explored across equipment, methods, materials, people, measurements, or environmental conditions.
For more complex pharmaceutical investigations, both tools can be used together:
- Define the problem and assess its immediate impact.
- Use a Fishbone Diagram to identify possible causes.
- Prioritize the causes that are most plausible based on evidence and risk.
- Apply the 5 Whys method to explore selected causal pathways.
- Verify the suspected root cause using objective evidence.
- Develop CAPA based on the confirmed findings.
- Evaluate whether the actions are effective.
For example, in a recurring equipment failure investigation, the Fishbone Diagram may identify maintenance, operating conditions, equipment design, and operator practices as potential contributors. The 5 Whys method can then be applied to a particular pathway, such as a recurring maintenance gap.
Root Cause Analysis and CAPA in Pharma
https://pharmavk.com/Why-is-CAPA-Correct/
RCA and CAPA are closely related but have different purposes.
Root Cause Analysis identifies and evaluates the reasons a problem occurred. CAPA defines and implements appropriate actions to correct the issue, address its underlying cause, and prevent or reduce recurrence.
A typical sequence is:
Problem identification → Immediate correction or containment → Investigation → Root cause verification → CAPA planning → Implementation → Effectiveness check
Example of RCA and CAPA
Consider a recurring failure in a laboratory incubator’s temperature monitoring.
| Activity | Example |
|---|---|
| Problem | Temperature excursions recur in the incubator. |
| Immediate action | Assess the affected activities and materials, and follow the applicable procedure for containment. |
| RCA tool | Fishbone Diagram to identify possible equipment, method, monitoring, and maintenance causes. |
| Verification | Review temperature logs, maintenance records, alarm history, and instrument performance. |
| Root cause | A monitoring alarm was not configured to alert the responsible personnel during an unattended period, if supported by the investigation. |
| Corrective action | Correct the alarm configuration and verify its functionality. |
| Preventive action | Review alarm management practices for other relevant equipment and update procedures or training if justified. |
| Effectiveness check | Review subsequent alarm performance and monitoring records against predefined criteria. |
The example demonstrates the logic of an investigation. The stated cause and actions must be adapted to the actual event and confirmed by evidence.
Common Mistakes in RCA and CAPA
- Accepting the first explanation without further investigation.
- Blaming an operator without examining procedural or system-related factors.
- Treating a Fishbone Diagram as proof of the root cause.
- Asking the 5 Whys repeatedly without verifying answers.
- Implementing retraining as the only solution when system or process weaknesses remain.
- Failing to assess the impact on affected batches, samples, or records.
- Defining CAPA without linking it to the investigation findings.
- Closing CAPA without evaluating effectiveness against predefined criteria.
Documentation Required for Root Cause Analysis
Documentation depends on the type and significance of the event and the organization’s quality procedures. Typical records may include:
- Deviation, complaint, or incident record.
- Clear problem statement and event chronology.
- Initial containment and impact assessment.
- Supporting records, logs, test results, and interviews.
- Risk assessment, where appropriate.
- Completed 5 Whys worksheet or Fishbone Diagram.
- Evidence supporting or excluding potential causes.
- Identified root cause and rationale.
- CAPA plan, responsibilities, and target dates.
- Implementation evidence and effectiveness assessment.
- QA review and investigation closure.
Good documentation should make the reasoning traceable from the observed problem through the investigation findings to the selected actions.
Frequently Asked Questions (FAQs)
1. What is the difference between RCA and CAPA?
RCA identifies the underlying cause of a problem. CAPA defines and implements actions to correct the problem and address its cause, with effectiveness checks where appropriate.
2. Is the 5 Whys method mandatory in pharmaceutical investigations?
The 5 Whys method is a useful investigation tool, but it is not universally mandatory for every pharmaceutical investigation. The method should be selected according to the problem, risk, available evidence, and the organization’s approved procedures.
3. Can a Fishbone Diagram identify the root cause directly?
A Fishbone Diagram organizes possible causes but does not independently confirm which cause is responsible. The selected causes must be evaluated and verified using relevant evidence.
4. Can both methods be used in the same investigation?
Yes. A Fishbone Diagram can help identify several potential causes, while the 5 Whys method can explore selected causal pathways in greater depth.
5. What should be done if the root cause cannot be confirmed?
Document the investigation performed, the evidence reviewed, and the limitations encountered. Evaluate remaining risks and determine appropriate next steps according to the quality procedure. Do not present an unverified assumption as a confirmed root cause.
6. How do you know whether CAPA is effective?
Effectiveness should be assessed against predefined, measurable criteria appropriate to the problem. Depending on the event, this may include reviewing recurrence, relevant quality trends, process performance, or completion of specific verification activities.
Conclusion
Root Cause Analysis is an important part of pharmaceutical quality management because it helps organizations understand why quality problems occur and develop appropriate actions to prevent recurrence.
The 5 Whys method is useful for exploring a relatively straightforward chain of causes, while the Fishbone Diagram provides a structured way to investigate multiple potential contributors. Both methods depend on clear problem definition, objective evidence, and scientific reasoning.
In pharmaceutical manufacturing, the goal is not simply to complete an RCA form. It is to establish a defensible conclusion, implement appropriate CAPA, and verify that the actions effectively address the problem.
By applying these tools thoughtfully, QA, QC, production, and engineering teams can strengthen investigations, improve process reliability, and support a robust Pharmaceutical Quality System.